Citation rate vs share of voice — what each metric tells you, and when each one lies
Citation rate is how often you appear. Share of voice is how much of the answer you own. Both matter in AI search — here's how to read each.
Every AI search visibility dashboard reports two headline numbers: citation rate and share of voice. They look interchangeable. They are not.
A brand with 80% citation rate and 30% share of voice is named in most answers but always alongside many competitors. A brand with 50% citation rate and 50% share of voice is named in fewer answers but dominates when named. These two profiles call for completely different content responses. Confusing them — or worse, optimizing for one while you needed the other — is the most common mistake we see in AI search optimization work.
This guide defines both metrics precisely, shows how each behaves when the other moves, and gives the diagnostic playbook for what each gap means.
The precise definitions
Citation rate is the fraction of dispatched cells in which your brand is mentioned anywhere in the AI engine's answer body.
citation_rate = cells_where_brand_mentioned / total_cellsA "cell" is one query-platform-persona triple. A standard Brand Radar run with 10 queries × 5 platforms = 50 cells; if your brand is named in 32 of them, your citation rate is 64%.
Share of voice is your brand's total mentions divided by the sum of all brand mentions across all dispatched cells.
share_of_voice = your_brand_mentions / total_brand_mentions_across_all_cellsIf across 50 cells, your brand was named 32 times, competitor A was named 28 times, competitor B 20 times, and three other brands accumulated 50 mentions between them, the total brand-mention pool is 130 and your share of voice is 32 / 130 = 25%.
The deeper citation rate glossary entry and share of voice glossary entry cover the definitional edges; this guide is about how to use both together.
Why both numbers, not one
A single-metric dashboard would tell you whether you're visible — but not whether you're winning. Every brand visible in an answer is also losing the half-second of attention to every other brand mentioned in the same answer. The two-metric pair captures both halves of the truth:
- Citation rate answers: "When a target customer asks this kind of question, does the AI engine include us in its answer?"
- Share of voice answers: "When we are included, how prominent is our mention relative to everyone else the engine listed?"
A brand can have high citation rate and low share of voice (visible but drowning in competitors). A brand can have low citation rate and high share of voice (rarely surfaces but owns the answer when it does). Each of these four quadrants has a distinct diagnosis and a distinct playbook.
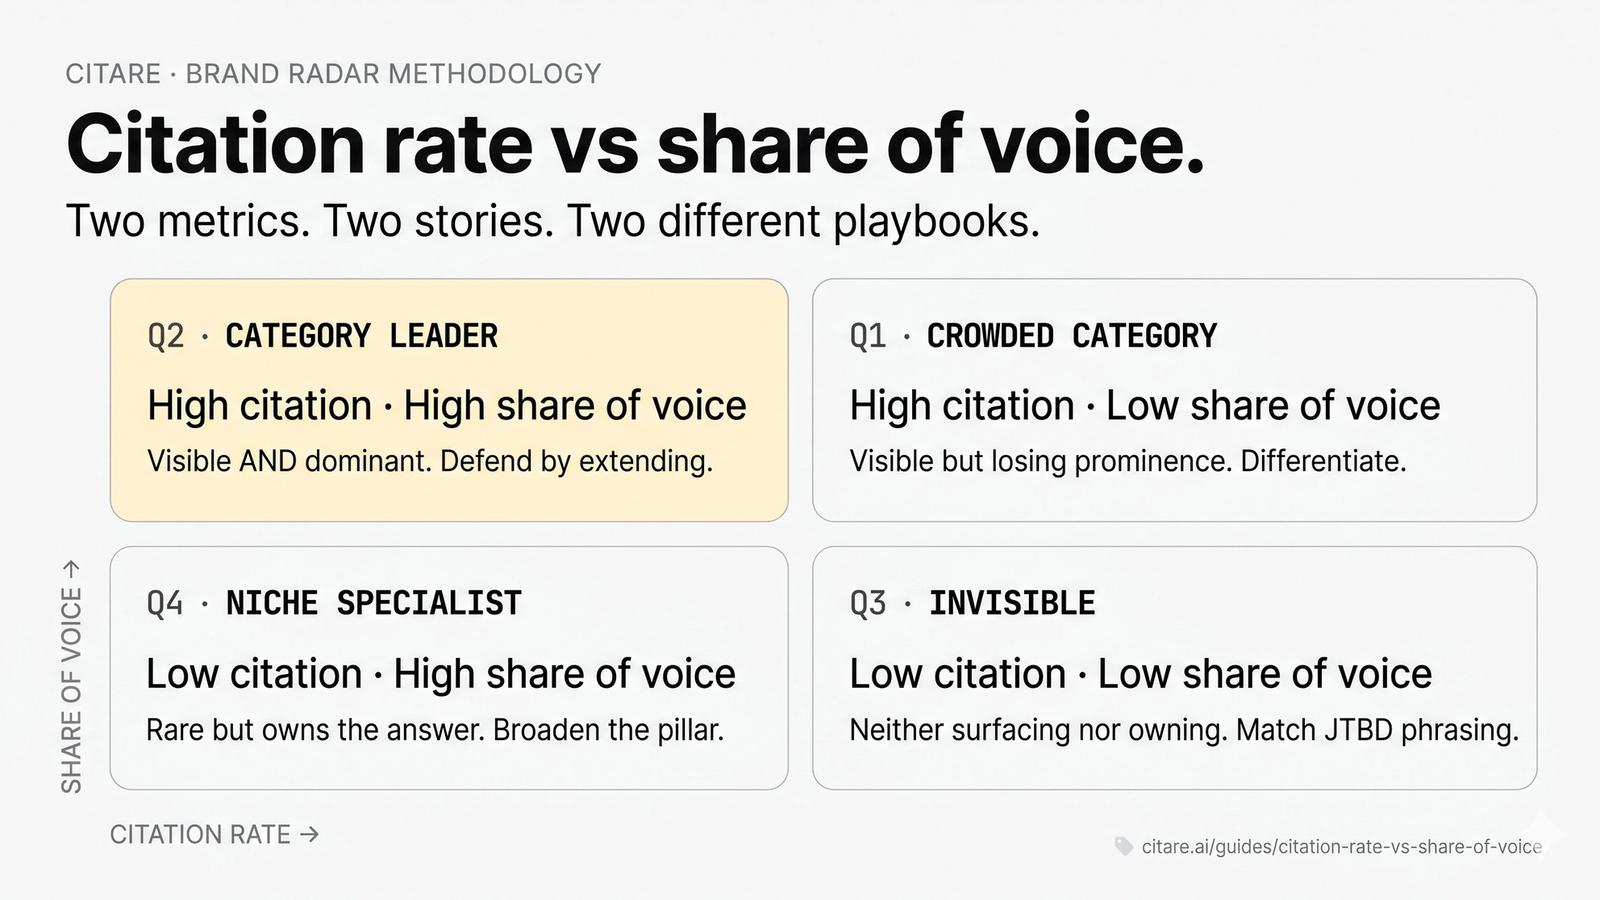
The four quadrants
- **High citation rate — Low share of voice: Crowded category — you're visible but losing prominence to competitors · High share of voice**: Category leader position — visible AND dominant when present
- **Low citation rate — Low share of voice: Invisible — neither surfacing nor owning when surfaced · High share of voice**: Niche specialist — rarely surfaces but owns the conversation when it does
Quadrant 1: high citation rate, low share of voice
This is the most common profile for SaaS brands in mature categories. You surface on most relevant queries — but the AI engine names 4-6 competitors alongside you on every answer, and your brand is one of many. ChatGPT's response to "best CRM for SMB" will mention HubSpot, Pipedrive, Zoho, Freshsales, Close, and three others; if you're in that list, citation rate is high but share of voice is divided 8 ways.
The diagnosis: the category is well-mapped in the underlying index, and the AI engine has no reason to prefer you over the others. The mechanism that produces this state is content that is "good enough to mention, not differentiated enough to lead."
The playbook: introduce structured comparison content — explicit "X vs Y" pages, named-competitor head-to-heads, side-by-side feature tables with FAQPage schema. The goal is to give the AI engine a reason to position you as the answer to a specific sub-query rather than as one of many answers to a generic query.
Quadrant 2: high citation rate, high share of voice
This is category leadership. You surface on most relevant queries and you're named at position #1 most of the time. The AI engine treats your brand as the canonical answer. Examples we've measured: Notion on "all-in-one workspace for early-stage startups" (15/15 ChatGPT surface, position 1.40 avg), GitBook on "documentation platform for engineering teams" (5/5 across platforms, position 1.00 on 4/5).
The diagnosis: you've successfully owned the category-defining language. Your content uses the JTBD phrasings the AI engine pattern-matches against; competitors don't.
The playbook: defend by extending — publish category-adjacent JTBD content before competitors do. The risk in this quadrant is complacency; a competitor that ships a "[your category] in 2026" page with sharper structured data can pull share of voice back inside one model refresh cycle.
Quadrant 3: low citation rate, low share of voice
You're invisible. The AI engine doesn't surface you on relevant queries, and when it does, you're a footnote.
The diagnosis: either the brand is genuinely too small for the model's grounding indices to weight your content meaningfully, or your content doesn't use the language the model expects for the JTBD. The Notion audit's Finding 9 captured exactly this state on the agent-readability JTBD — Notion was absent from AIO, Perplexity, and Claude on Q11 because no notion.com page uses the phrasing "AI agents can read from and write to," even though Notion ships an MCP server that does exactly that.
The playbook: publish JTBD-phrased pages targeting the literal query strings the AI engine returns to your absent slots. The fix is mechanical — match the query phrasing in the page H1 and the opening definitional sentence. If the model's response pattern is "Traditional wikis like Notion fail because [reason]," the response is to publish a page whose H1 contradicts that frame directly.
Quadrant 4: low citation rate, high share of voice
Rare but real. You surface only on a narrow slice of queries — but when you do, the AI engine names you alone or alongside one other brand. This profile is typical of niche specialists with strong topical authority on a tight JTBD.
The diagnosis: your content is highly differentiated on a narrow vertical, but you don't have surface area on adjacent JTBDs in the same category.
The playbook: broaden the pillar. If you own "X for engineers" but don't surface on "X for product teams," "X for ops teams," or "X for finance teams," each of those is a near-trivial spoke page. The hard part is already done — model trust on the differentiated JTBD; the leverage is publishing parallel JTBD spokes that inherit it.
How each metric moves week over week
Citation rate and share of voice move on different cadences in response to different stimuli. Reading the deltas correctly is the work.
- New pillar page published on JTBD query — Citation rate response: Goes up · Share of voice response: Slight up · Time to manifest: 2-6 weeks (depends on platform crawl)
- Competitor publishes equivalent page — Citation rate response: Flat · Share of voice response: Down (you're now sharing the slot) · Time to manifest: 1-4 weeks
- Underlying model refresh / training cut — Citation rate response: Sharp move either direction · Share of voice response: Sharp move either direction · Time to manifest: Immediate (week of refresh)
- Brand mentioned in major news event — Citation rate response: Up (temporary spike) · Share of voice response: Up (temporary spike) · Time to manifest: Days; decays over 2-4 weeks
- Schema.org markup added to existing pages — Citation rate response: Slight up on structured-data-favoring platforms (Gemini, AIO) · Share of voice response: Slight up · Time to manifest: 2-4 weeks
- llms.txt published — Citation rate response: Negligible direct effect; measurable on Perplexity / Claude / ChatGPT search · Share of voice response: Negligible direct effect · Time to manifest: 4-8 weeks if any
The single most-common cause of confusing week-over-week movement is competitor publishing. If your citation rate is flat and your share of voice dropped 8 points, the most likely explanation is not that you got worse — it's that a competitor published equivalent content and the AI engine now divides the same answer slot between you and them. Counter-intuitive but routine.
When each metric lies
Both metrics have well-known failure modes. Knowing them is the difference between actionable read and misleading read.
Citation rate lies when the query mix drifts
If week 1 dispatches 60% category queries and 40% comparison queries, but week 2 dispatches 40% category + 60% comparison, citation rate will move purely because comparison queries name your brand by construction. Brand Radar locks the Query Guide at draft time and freezes the mix between weeks specifically to prevent this. If you're running visibility tracking outside Brand Radar, the first failure mode to check is mix drift.
Citation rate lies when the brand name leaks into anti-prime queries
The single biggest measurement bug we see in self-rolled AI search monitoring is failing to enforce the anti-prime rule on category and JTBD queries. If your dispatch script feeds "best [category] tool — is [your brand] worth it" to ChatGPT, ChatGPT will say yes, your citation rate will be 100%, and you have measured nothing about your actual visibility.
Share of voice lies when one competitor goes viral
Share of voice is a ratio — your mentions divided by total mentions. If a single competitor 10× their mention count in a single week (Hacker News launch, big press hit, model refresh that suddenly favors their content), your share of voice will drop sharply even though your absolute mention count is unchanged. Always pair share of voice with citation rate; if your citation rate is flat and only share of voice fell, the cause is competitor noise, not your performance.
Share of voice lies on very small cell counts
Below ~30 cells in a dispatch, share of voice has too much sample variance to read reliably. A standard 50-cell weekly Brand Radar run is well above the threshold; a 10-cell quick-test dispatch is below it. If you see share of voice swing 15 points week-over-week on a small dispatch, the cause is sampling noise, not real movement.
The two-metric trend dashboard
The right way to read the pair over time is to chart both on the same axis, week-over-week, for 8-12 weeks of history. The shape of the trend tells the story:
- Both rising together — you're winning new ground. Continue the content cadence that produced the rise.
- Citation rate rising, share of voice flat — you're surfacing more often but not in a more prominent position. Time to invest in differentiation (structured comparison content, head-to-head pages).
- Citation rate flat, share of voice falling — competitor noise. Investigate which competitor's mentions grew; consider a positioning post.
- Both falling together — a real visibility problem. Check for an underlying model refresh in the same week; if confirmed, the response is content investment in the JTBDs that lost the most cells.
- Citation rate falling, share of voice rising — you're surfacing on fewer queries but dominating the ones you still hit. Often a sign that the AI engine has narrowed your "topical authority footprint" to a tighter category, which can be good (specialist positioning) or bad (lost adjacent JTBDs).
Brand Radar exposes both lines on the main project dashboard with toggleable platform filtering — so a Claude-specific share-of-voice drop doesn't get smoothed away in the 5-platform average.
The shorter answer
If you only remember one thing: citation rate is breadth, share of voice is depth. A complete AI visibility read requires both, watched together, over time. Either alone produces a partial picture that's easy to optimize against and wrong half the time.
Frequently asked
Is citation rate the same as Brand Radar's "surface rate"? Yes. We use "surface rate" in audit headlines because the word "surface" reads better in a sentence; the underlying calculation is identical to citation rate. Most published audits on /audits use "surface rate" interchangeably.
Can share of voice exceed 100%? No. By construction, share of voice is a ratio of your mentions to total mentions, and total mentions is the denominator including yours. The maximum value is 100%, which only happens if no competitor was ever named alongside you across the entire dispatch — a near-impossible profile in any real category.
How is share of voice different from "rank" in classic SEO? Classic blue-link SEO rank measures your position in an ordered list of 10 results. Share of voice measures the prominence of your brand mentions in synthesized AI-generated text where there is no "list of 10" — the AI engine writes a paragraph and your brand is one of several names embedded in it. Both metrics describe relative prominence, but the underlying surface and ranking mechanism are completely different. See AI search vs Google SEO for the comparative.
Which metric should I optimize for first? Citation rate first if you're below 30% — visibility comes before depth. Share of voice first if your citation rate is already above 60% — at that point the leverage is winning more of the answer, not getting into more answers. The threshold isn't sacred; teams with strong category-defining JTBDs can compound both simultaneously.
Why don't you publish a single "AI visibility score"? Because the two metrics call for different responses, and a bundled score hides which one is moving. We tried it in an early version of Brand Radar; customers consistently misread the bundled score because the same number could come from "high citation, low SOV" or "low citation, high SOV" — two completely different brand situations. Surfacing both separately is the right call.
Ready to read your own trend?
The Free tier covers one project with weekly Brand Radar dispatch including both metrics + competitor delta. Onboarding takes ~10 minutes — domain → Query Guide edit → first run in 90 minutes.
→ Read the Brand Radar methodology deep-dive to see how both metrics are computed
→ See the published Notion audit — both metrics reported per platform across 75 cells
→ The full Brand Radar product page for tier comparison